Liqwid Protocol - Data analytics over the past 12 months

Dear Liqwid Community,

I have compiled several data points related to our protocol (Period: 01.02.2023 - 01.03.2024), and I am sharing with you the main facts that I believe are relevant to know.

The conclusions and actions resulting from this information and data analytics will be shared and proposed by the Core Team within the next 1-2 weeks. Additionally, everyone is welcome to draw their own conclusions and share them in this post.

The master file containing this data can be found here.

1.Macro view – ADA & LQ price development

Figure 1: Price development of LQ and ADA (base 100) over the last months, including the LQ daily emissions as part of the market incentive.


In this graphic, we can visualize the development of the LQ price versus the ADA price over the last 12 months (normalized price : base 100).

We observe that during this period, despite LQ inflation remaining stable at approximately 100k LQ per month, the LQ price was going down while ADA remains stable.

Also, it LQ price drop even increased in 2024, further accentuating the divergence between ADA and LQ price developments.Since January 1, 2024 to March 1, 2024, the price of LQ did -33% ( from $3.5 to $2.4, while the price of ADA did +10% (from $0.59 to $0.66)

2.Effect of LQ incentives over time

The total $amount of LQ rewards given only for the “market distribution incentive” has reached $8.3M over the last 12 months.

This represents a total around 1.6M of LQ distributed in the hands of the Liqwid community (~7.6% of the total supply).

For comparison, Liqwid raised $2.7M from private investors, which was the only time when Liqwid sold LQ tokens.

We can also note that during the same period of time, we witnessed the price of LQ being divided by 6, while the price of ADA increased by +67%. (Utilisation of normalized LQ and ADA price to present the value in a comparable basis).

Today, the Fully Diluted Valuation of Liqwid is around $50M, and it means that ~15% (~8M/50M) of the protocol value was distributed to the users of the protocol.

3.Liqwid protocol profitability analysis

Since its inception, the protocol has successfully raised its TVL to more than $70 millions. At the same time, the profitability (“$ value of LQ distributed” – “$ value of accrued interests”) also increased, but mostly due to the fact that the costs side was being reduced, as the LQ price was falling.

Note: In the excel file under the link, you can also access the breakdown of the TVL per assets and the accrued interests.

4.Costs of liquidity acquisition

This graphic is showing that in February 2023, when 210’000 LQ were distributed monthly, Liqwid paid 1$ to attract 3$ of TVL.

  • It means that If someone supplied $10’000 during the whole February, this person received $3’333 worth of LQ. (10’000 / 3’333 = 3)
  • It means that If someone supplied $10’000 during the whole March, this person received $2’176 worth of LQ. (10’000 / 2’173 = 4.6)

At the same time in February 2024, some borrowings were made and generated some revenues. For 1$ of incentives, the protocol received $3 of TVL and $0.04 of revenues.

Analysis of the purple line “ Paid $1 of LQ for X$ of accrued interests”:

A value of $1 would mean that in term of profitability the $ amount of accrued interests equals the $ amount of LQ incentives.

A value above $1 would mean that in term of profitability the $ amount of accrued interests is superior to the $ amount of LQ incentives.

We note that this ratio was only positive at the end of February 2024, but it seems to be attributed more to the LQ price falling that to the accrued interests being accumulating at a bigger pace.

5. Analysis of the revenues from accrued interests compared to repaid interests

As the Liqwid protocol offers perpetual loans, no revenue is collected at loan origination (although this may change with the upcoming governance vote on this matter). The interest generated by existing loans is referred to as accrued interest, which is repaid once the loans are closed.

In the chart provided, we can observe that repaid interest aligns with accrued interest. It’s important to note that a loan being opened and closed within the same month does not generate accrued interest, which explains why accrued interest appears lower than repaid interest.

Recently, it has become evident that the high utilization of stablecoin markets is resulting in significantly higher accrued interest compared to repaid interest.

Opinion:
We can assume that currently, people are anticipating a bull run, and their priority is not selling their tokens to repay the loan.

In the past weeks, we have seen a clear acceleration of these 2 data being decorrelated.

This shift is anticipated to persist for several months.

Consequently, if the governance vote passes and interest rates rise, it will further accelerate the accumulation of accrued interests compared to the growth rate of repaid interests.

6. Projected LQ emissions for 2024 (Staking and market distributions)

Figure 6: Projection based on the current LQ emissions

Market incentives | current data: Given the current rates of LQ emissions, the protocol will distribute:

  • LQ 20k monthly given for the borrowers
  • LQ 100k monthly given to the suppliers

Staking rewards incentives | projected data: Given the current rates of LQ emissions, the protocol will distribute around:

  • LQ 38k monthly until the end of May (starting for the month of March)
  • LQ 138k monthly starting in June.
    Note 1: These forecasts are based on the total amount of LQ being staked by the current stakers monthly of the last 12 months.
    Note 2: Originally 10% of the LQ supply (2.1M LQ) has been allocated for the staking rewards in the tokenomics.
    *Note 3: The Core Team is not receiving since inception any staking rewards or programmatic distribution for their LQ tokens staked.

If everything is staying the same, around 16.4% of the total LQ supply will be distributed for the year 2024.

10 Likes

Respect!. Its very perfect

Great data thank you. I wonder if we should consider reducing the time-in-stake APY bonus. 30/50 always seemed pretty generous, and we could extend the initial staking reward supply. I doubt it would have a significant negative response/impact since most emissions draw from supplier incentive anyways.

1 Like

Do you have an explanation for the abrupt leveling out of profitability in June? That was shortly after the dynamic emissions proposal and doubling of Aquafarmer APY boost. But LQ/USD in that time frame was actually downtrending and the APY boost increased LQ rewards… Only the last should have had a negative impact on profitability.

1 Like

It is great to see this. Thank you for sharing. As stated in the post, I have requested access to the Link of the Data. I am curious to dive into this and help explore what this all means.

Point 6:
I am unsure how these numbers were created. Looking at the current Circulating supply of 4.8 million, assuming that all of this is staked and earning 50%, we would see 2.4 million in rewards at 200k a month, which is 50% less than projected in Dec. 2024 even if all of the rewards were restocked and compounded. We would need 10.7 million staked at 50% to hit a reward month 450k. I do like the projection of when this original pool will run and if we are indeed achieving the original goal that was planned out.

image

Point 1:

This is a nice narrative to explore. It would be great to see it at multiple length intervals. Auspiciously, right after this analysis was posted, LQ price and ADA have flipped, with LQ erasing Q1 2024 decline in 24 hours with a 40% uptick in price movement/ returning to Jan. 1 2024 price of 3.50. TBD to see what holds. It would be great to see how the trend line supports this, with LQ down 50% for a year and ADA up 110% for the year.

I like seeing capital efficiency (CE) applied to the other points and the general improvements in CE. Along with customer acquisition costs (CAC)

If data is available, I would love to see some trendline of Capital efficiency.

Initial thoughts: I love seeing the work here; thank you for sharing and discussing with the community.

1 Like

@ConkeyKong
As I have not conducted the extraction and forecasts personally, I will seek clarification. Nevertheless, please share your model based on the following assumptions:

  • 120k LQ monthly (comprising borrowers’ and suppliers’ rewards)
  • 70% monthly restaking for both stakers and suppliers

However, I am curious why there is no mention of the connection between the Figures1/2 and Figure 6. It seems like the elephant in the room. Any thoughts on this?

On my end, I will soon be publishing my analysis of these results and sharing my recommendations for the Liqwid community’s next steps.

3 Likes

June last year corresponds to the launch on Liqwid of DJED and iUSD, which generated a lot of accrued interets.

1 Like

@FlorianVolery
I will work on a model for the assumptions you laid out. Oddly enough, working off of the most recent LQ Staking Rewards, I see rewards paid out on 2.3 million staked LQ vs. the dashboard showing the 3.28 million staked. I need to double-check it. I am currently assuming that the team’s stake is not receiving rewards.

I see the Elephant that you are pointing out. I am not sure if I have more than observations about it at this time; in general the analysis is looking at the divergence of the two tokens’ price points vs showing the correlation of LQ emissions on price. Capturing the normalized Volume(Volume might be the missing piece. And then apply. Capital Efficiency(CE) formula of CE=Volume / TVL: Apply that monthly line graph to the LQ emissions and see what the divergence looks like there.

The main observation I see now is the inflation of the two tokens. ADA & LQ. ADA is ~3.9%, and LQ is closer to 33%+ over the same time frame. This would allow ADA a more stable price and LQ to be more volatile / sell pressure.
120K + 28K current Staking rewards per four weeks. 148K per month. 1.6million / 12 = 133k.
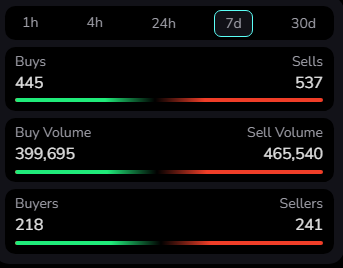
The past month on Taptools.io showed a sell > Buy, with ~100k more LQ being sold than bought. You can see this in the recent surge in price: 7-day volume at a +150k buy, where 30-day is a buy—3k.

image
image

Couple Thoughts here, 8.3/50 =16.6%.
Using the normalized $amount of LQ rewards with the actual present-day FDV vs. using normalized FDV. Taking $2.4*1.6mil LQ = $3.8mil 3.8/50=7.6 %. The current value as of March 1st was 7.6% of the protocol Value.

2 Likes

@FlorianVolery some answers make be found here in the analysis I put together for the DAO POL in another proposal.

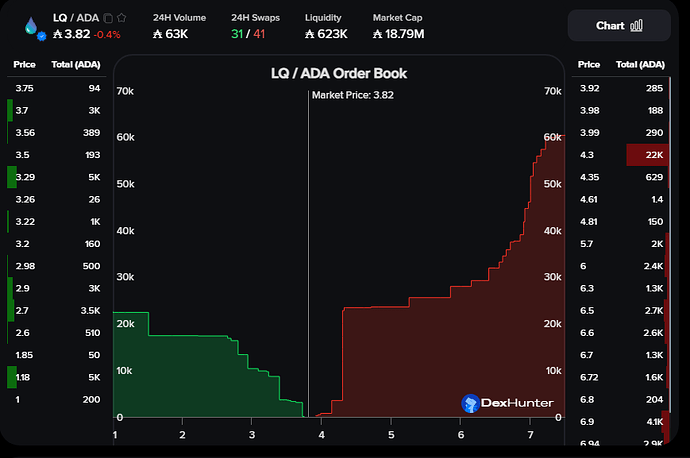
Please let me know your thoughts on it. There is an opportunity to use LQ emissions that bring in more revenue that will encourage price development more positively long-term, 2-3 years plus. Along with allowing short-term 6 months -2 years stability for larger LQ orders to be placed. and finally with micro term (now- 6 months) to explore LQ liquidity in a slow determined way.

1 Like

Regarding Point 6.
The projection of staking rewards emission

I was waiting for the weekly staking rewards with 50% stakes to be published before making any calculations and conclusions.

As ConkeyKong already pointed out:

  • the monthly rewards to reach 138.2k would require 3.31m being staked, LQ earning 50% APR.
  • the monthly rewards to reach 334.9k would require 8.08m being staked, LQ earning 50% APR.
  • the monthly rewards to reach 450k would require 10.8m being staked, LQ earning 50% APR.
    Calculation: 450,000 x 12 / 0.5 = 10,800,000

Reality:
2 million LQ staked was crossed in October '23
3 million LQ staked was crossed in February '24
3.33 million LQ staked is the current volume.

Looking at the weekly staking rewards totals from the past:

Sep 3-10th '23, a full week, the total is 1,123
6 month snapshot on Sep 13th '23
Sep 18-24th '23, a full week, the total is 4,440
Sep 25-Oct 1st '23, a full week, the total is 4,498
. .
. .
Feb 26-March 3rd '24, a full week, the total is 7,142
March 3-10th '24, a full week, the total is 7,200
12 month snapshot on March 11th '24
March 11-17th '24, the total is 9,958

Conclusion:
The projection has too much of a jump in staking rewards every 3 months while the weekly numbers show the real jump to a higher APR happens after every 6 months of uninterrupted staking, then continue to grow at a steady pace for 6 months.
The projection is also based on an unrealistic high volume being staked at the highest APR.

2 Likes

@FlorianVolery @DC1 @nufnuf

updated LQ stake pool depletion:
(Copy of Liqwid - LQ Token distribution vFinal - 1 02 2023.xlsx - Google Sheets)

Start Date Month User Distribution DAO Treasury Safety Pool
2/28/2023 0 200,000 1,365
3/31/2023 1 400,000 3,317
4/30/2023 2 600,000 6,305
5/31/2023 3 700,000 10,330
6/30/2023 4 800,000 15,106
7/31/2023 5 900,000 20,633
8/31/2023 6 1,000,000 43,245
9/30/2023 7 1,100,000 68,751
10/31/2023 8 1,200,000 97,181
11/30/2023 9 1,300,000 128,566
12/31/2023 10 1,400,000 162,937
1/31/2024 11 1,520,000 200,325
2/29/2024 12 1,640,000 240,972
3/31/2024 13 1,760,000 284,912
4/30/2024 14 1,880,000 342,684
5/31/2024 15 2,000,000 404,701
6/30/2024 16 2,120,000 471,017
7/31/2024 17 2,240,000 541,687
8/31/2024 18 2,360,000 616,767
9/30/2024 19 2,480,000 696,314
10/31/2024 20 2,600,000 810,957
11/30/2024 21 2,720,000 932,383
12/31/2024 22 2,840,000 1,060,712
1/31/2025 23 2,960,000 1,196,063
2/28/2025 24 3,080,000 1,338,560
3/31/2025 25 3,200,000 1,462,830
4/30/2025 26 3,320,000 1,591,374
5/31/2025 27 3,440,000 1,724,267
6/30/2025 28 3,560,000 1,861,586
7/31/2025 29 3,680,000 2,003,408
8/31/2025 30 3,800,000 2,149,813

***I should note I had to guess what % of the teams LQ was elected by the founders not to earn staking rewards. I used 40% as the LQ staking distribution shows about 800K being staked but not receiving rewards.

The 120k assumption remained.
However, the 70% staked assumption seems to be true for the present day and recent months, yet not true for the first 10 months. Assuming 50%, in the modeling, restakingfor the first 8 months lines up with LQ staking rewards released in Discord and as referenced by @nufnuf below

When looking at LQ distribution rewards documents released in Discord, we can see that the APR for weeks at the 6 months and 12 months are 17% and 22% respectively indicating that not all staking emissions are maintaining weighted time and/or rolling back into new stake positions. Regardless, when setting the 6 months & 12 months and each month after at 30% and 50%. Staking rewards expire 1/1/2025. Using actual percentages from LQ staking documents, expiration models closer to May-July+ 2025. Expiration should be expected mid to late 2025.

Looking at the modeling shows that month-over-month inflation % of LQ is decreasing by 0.3% a month
However, sell token inflation is currently higher but reducing at a similar rate 0.3-0.4% a month. ( this is the 30% that is not restaked)
This disparity equates to on average 90K worth of LQ going on the market to be sold or sitting in wallets. This is roughly 50% of the LQ emissions per month.(user and LQ staking)

When looking at TapTools we can see an additional sell pressure (buy volume less than sell volume) on average 100K LQ per month. We can see in the last 7 days with LQs recent spike in price that sell pressure 60K higher causing downward price pressure.
image

to counter this reducing LQ emissions by up to 30-50% a month should stabilize price.160k= 120K+40K( off of most recent LQ staking rewards).

Currently, LQ staking is not modeled to jump until June/September depending on modeling. I lean towards September. Meaning, if desired LQ emissions can be reduced on user distribution first to see effect if we want leave staking alone to start with.

Removing the 20K borrower rewards would reduce 12.5%. Another 18% would need to be found.

1 Like

Any updates to share on further analysis?

2 Likes

Yes, the answer is there.

2 Likes

Great work, thank you!

1 Like